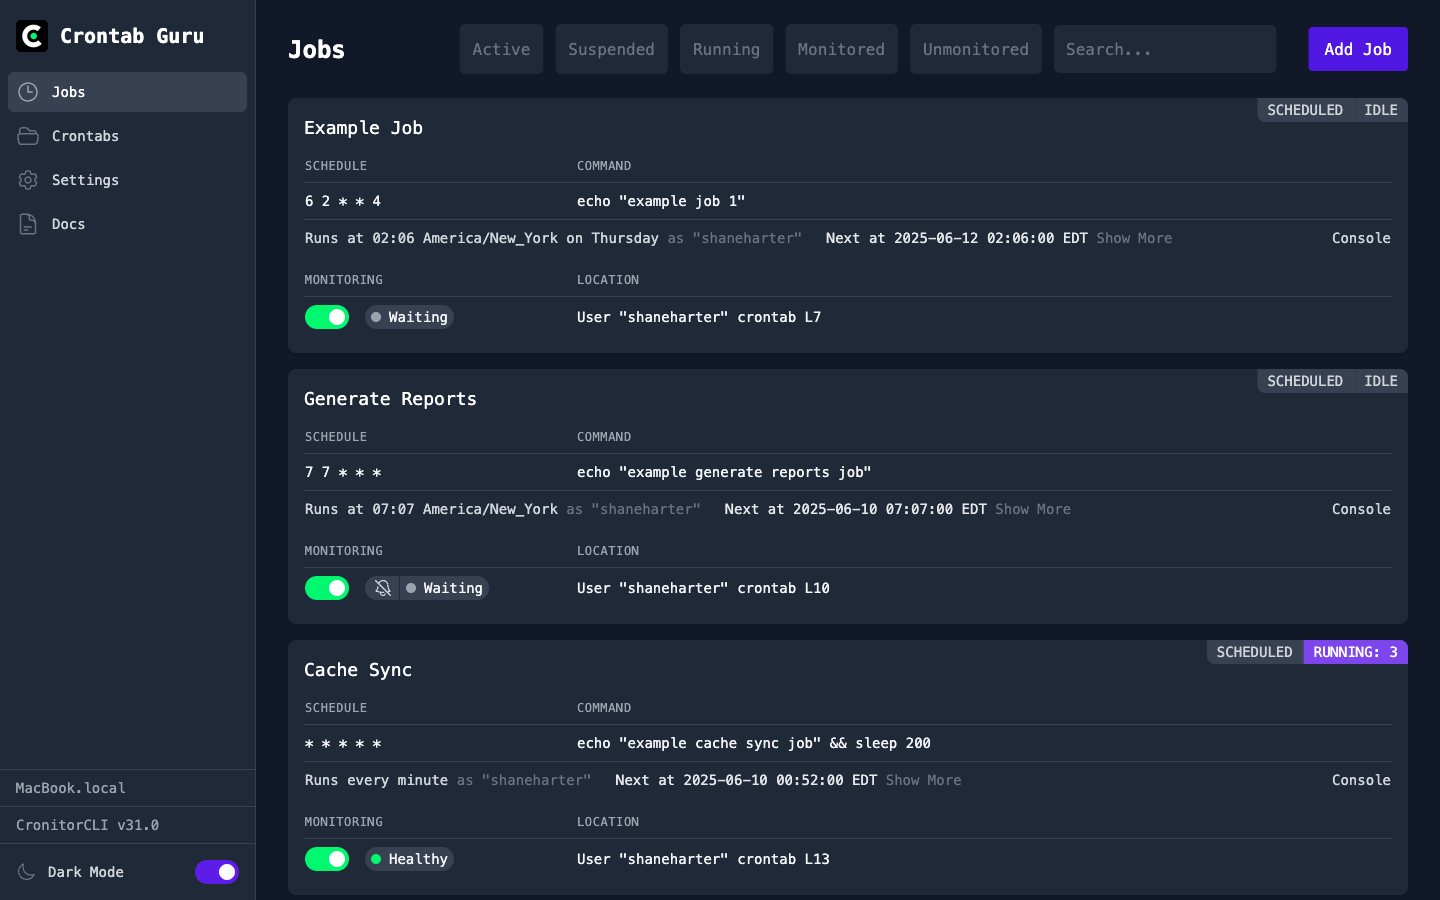
Cron Job Dashboard
The free, self-hosted, open source dashboard for managing your cron jobs.
- Create and manage your cron jobs
- Run jobs instantly with a single click
- Test and tweak jobs with the built-in console
- Crontab.guru expression editor built-in
- View and terminate running job instances
- Connect your coding assistant with MCP support
- Cron monitoring available when you need it
- Host it yourself and securely access via SSH
Easy Installation
View on Github
Installation Telemetry
During the installation process, telemetry is collected to help us anonymously count installs and detect issues with the installation process itself. These are GET requests that do not send any details about your server.
To opt-out, you can set an environment variable to disable telemetry:
curl https://crontab.guru/install | TELEMETRY=off sh
Linux Deployment Guide
Complete instructions for installing and running the Crontab Guru Dashboard
Installing the Dashboard
Running the Install Script
The easiest way to install the Crontab Guru Dashboard is using our automated install script:
curl https://crontab.guru/install | sh
This script will download and install the latest version of CronitorCLI, which includes the dashboard functionality.
Adding Username and Password Credentials
After installation, you'll be prompted to set a username and password for dashboard access. You can't use the dashboard without setting a username and password.
Accessing the Dashboard
Security Warning: The dashboard should not be exposed directly to the public internet. Always use secure access methods.
SSH Tunnel (Recommended)
The most secure way to access your dashboard remotely is through an SSH tunnel:
ssh -L 9000:localhost:9000 user@your-server
Then access the dashboard at http://localhost:9000
You can automate this by adding the following to your ~/.ssh/config:
Host your-server
  LocalForward 9000 localhost:9000
IP Whitelisting
For additional security, configure IP whitelisting to restrict access to specific addresses:
cronitor configure --allow-ips 192.168.1.0/24,10.0.0.1
Use IP whitelisting whenever possible to limit access to trusted networks and addresses.
Running with systemd
Setting Users
The current user crontab will be loaded automatically, and if you follow these instructions that will be the "root" user. As an alternative, you can specify users with the cronitor configure command. For example:
cronitor configure --users admin,user1,user2
Systemd Service Configuration
Create a systemd service to run the dashboard automatically. Before you start, if you are running the dashboard in another tab, or in a tmux or screen, exit that first so the port is free to use here. Save this as /etc/systemd/system/crontab-guru-dashboard.service:
[Unit]
Description=Crontab Guru Dashboard
After=network.target
Wants=network.target

[Service]
Type=simple
User=root
ExecStart=cronitor dash --port 9000
Restart=on-failure
RestartSec=5
StandardOutput=journal
StandardError=journal

[Install]
WantedBy=multi-user.target
Enable and start the service:
sudo systemctl enable crontab-guru-dashboard
sudo systemctl start crontab-guru-dashboard
sudo systemctl --no-pager --lines=0 status crontab-guru-dashboard
Keeping the Dashboard Updated
Regular updates ensure you have the latest features and security improvements:
cronitor update
After updating, restart the dashboard service:
sudo systemctl restart crontab-guru-dashboard
The dashboard will show an "update" button when a new version is available, making it easy to stay current.
Docker Deployment Guide
Run the Crontab Guru Dashboard in a containerized environment
Building a Docker Image
Creating the Dockerfile
Create a Dockerfile to build your own image with cronitor installed:
FROM alpine:latest

# Install dependencies
RUN apk add --no-cache \
    curl \
    bash \
    ca-certificates \
    dcron

# Install cronitor CLI
RUN curl -sL https://cronitor.io/dl/linux_amd64.tar.gz -o /usr/local/bin/cronitor && \
    chmod +x /usr/local/bin/cronitor

# Set up authentication - REPLACE THESE PLACEHOLDERS!
RUN cronitor configure --dash-username <YOUR_USERNAME_HERE> --dash-password <YOUR_PASSWORD_HERE>

# Expose dashboard port
EXPOSE 9000

# Run the dashboard
CMD ["cronitor", "dash", "--port", "9000"]
Building and Running
Build the Docker image:
docker build -t crontab-guru-dashboard .
Run the container:
docker run -d --name crontab-guru -p 9000:9000 crontab-guru-dashboard
Customizing with Build Arguments
For better security, use build arguments to set credentials:
FROM alpine:latest

# Build arguments - MUST be provided during build
ARG DASHBOARD_USERNAME
ARG DASHBOARD_PASSWORD

# Install dependencies
RUN apk add --no-cache \
    curl \
    bash \
    ca-certificates \
    dcron

# Install cronitor CLI
RUN curl -sL https://cronitor.io/dl/linux_amd64.tar.gz -o /usr/local/bin/cronitor && \
    chmod +x /usr/local/bin/cronitor

# Configure authentication
RUN cronitor configure --dash-username ${DASHBOARD_USERNAME} --dash-password ${DASHBOARD_PASSWORD}

EXPOSE 9000

CMD ["cronitor", "dash", "--port", "9000"]
Build with custom credentials:
docker build --build-arg DASHBOARD_USERNAME=<YOUR_USERNAME> --build-arg DASHBOARD_PASSWORD=<YOUR_PASSWORD> -t crontab-guru-dashboard .
Docker Compose Setup
Create a docker-compose.yml file for easier management:
version: '3.8'

services:
  crontab-guru:
    build:
      context: .
      args:
        DASHBOARD_USERNAME: ${CRONITOR_USERNAME}
        DASHBOARD_PASSWORD: ${CRONITOR_PASSWORD}
    container_name: crontab-guru-dashboard
    ports:
      - "9000:9000"
    volumes:
      - cronitor-data:/root/.config/cronitor
      - ./crontabs:/var/spool/cron/crontabs
    restart: unless-stopped

volumes:
  cronitor-data:
Create a .env file for credentials:
CRONITOR_USERNAME=<YOUR_USERNAME_HERE>
CRONITOR_PASSWORD=<YOUR_PASSWORD_HERE>
Start the service:
docker-compose up -d
Managing Cron Jobs
Container Cron Jobs
The dashboard will manage cron jobs within the container. To persist crontabs, mount a volume:
docker run -d --name crontab-guru \
  -p 9000:9000 \
  -v crontab-data:/var/spool/cron/crontabs \
  crontab-guru-dashboard
Managing Host System Cron Jobs
To manage host system cron jobs from the container, mount the host's cron directories:
docker run -d --name crontab-guru \
  -p 9000:9000 \
  -v /etc/cron.d:/etc/cron.d \
  -v /var/spool/cron:/var/spool/cron \
  -v /etc/crontab:/etc/crontab \
  crontab-guru-dashboard
Note: Managing host cron jobs requires appropriate permissions and may have security implications.
Running Jobs with Docker
To run cron jobs that interact with other Docker containers, mount the Docker socket and create jobs using docker exec:
docker run -d --name crontab-guru \
  -p 9000:9000 \
  -v /var/run/docker.sock:/var/run/docker.sock \
  crontab-guru-dashboard
Example cron job to backup another container:
0 2 * * * docker exec my-app-container /app/backup.sh
Docker Security
Important: Mounting the Docker socket provides full control over the Docker daemon. Only do this in trusted environments.
Network Isolation
For better security, run the dashboard on a custom Docker network:
docker network create crontab-network

docker run -d --name crontab-guru \
  --network crontab-network \
  -p 127.0.0.1:9000:9000 \
  cronitorio/cronitor:latest dash
This binds the port only to localhost, preventing external access.
Production Dockerfile with Secrets
For production deployments, read credentials from files instead of hardcoding:
FROM alpine:latest

# Install dependencies
RUN apk add --no-cache curl bash ca-certificates dcron

# Install cronitor CLI
RUN curl -sL https://cronitor.io/dl/linux_amd64.tar.gz -o /usr/local/bin/cronitor && \
    chmod +x /usr/local/bin/cronitor

# Copy and run setup script
COPY setup.sh /setup.sh
RUN chmod +x /setup.sh

EXPOSE 9000

# Run setup script then start dashboard
CMD ["/bin/bash", "-c", "/setup.sh && cronitor dash --port 9000"]
Create a setup.sh script:
#!/bin/bash
# Read credentials from environment or files
USERNAME=${CRONITOR_USERNAME}
PASSWORD=${CRONITOR_PASSWORD}

# Ensure credentials are provided
if [ -z "$USERNAME" ] || [ -z "$PASSWORD" ]; then
    echo "ERROR: CRONITOR_USERNAME and CRONITOR_PASSWORD must be set"
    exit 1
fi

# If password file exists, read from it
if [ -f "/run/secrets/cronitor_password" ]; then
    PASSWORD=$(cat /run/secrets/cronitor_password)
fi

# Configure cronitor with credentials
cronitor configure --dash-username "$USERNAME" --dash-password "$PASSWORD"